

When the Compass Flips: Decoding the Inverted Yield Curve as a Recession Signal
In the high-stakes world of global finance, few phrases send a shiver down the spine of an investor quite like "Inverted Yield Curve." Often regarded as the "Crystal Ball" of the bond market, this rare phenomenon has an almost uncanny track record of predicting economic downturns.
For those engaging in Forex Trading, the yield curve isn't just a chart for economists—it is a critical leading indicator. Understanding how an inversion impacts the US Dollar (USD), the Euro (EUR), or the Canadian Dollar (CAD) is a cornerstone of the curriculum at the GME Academy. When the yield curve flips, the "smart money" starts moving, and if you aren’t paying attention, you might find yourself on the wrong side of a massive market shift.
 https://images.squarespace-cdn.com/content/619b666b5842697e2af69258/a9d57b27-4fad-4532-874a-89133d6a85bc/P477.02.jpg?content-type=image%2Fjpeg
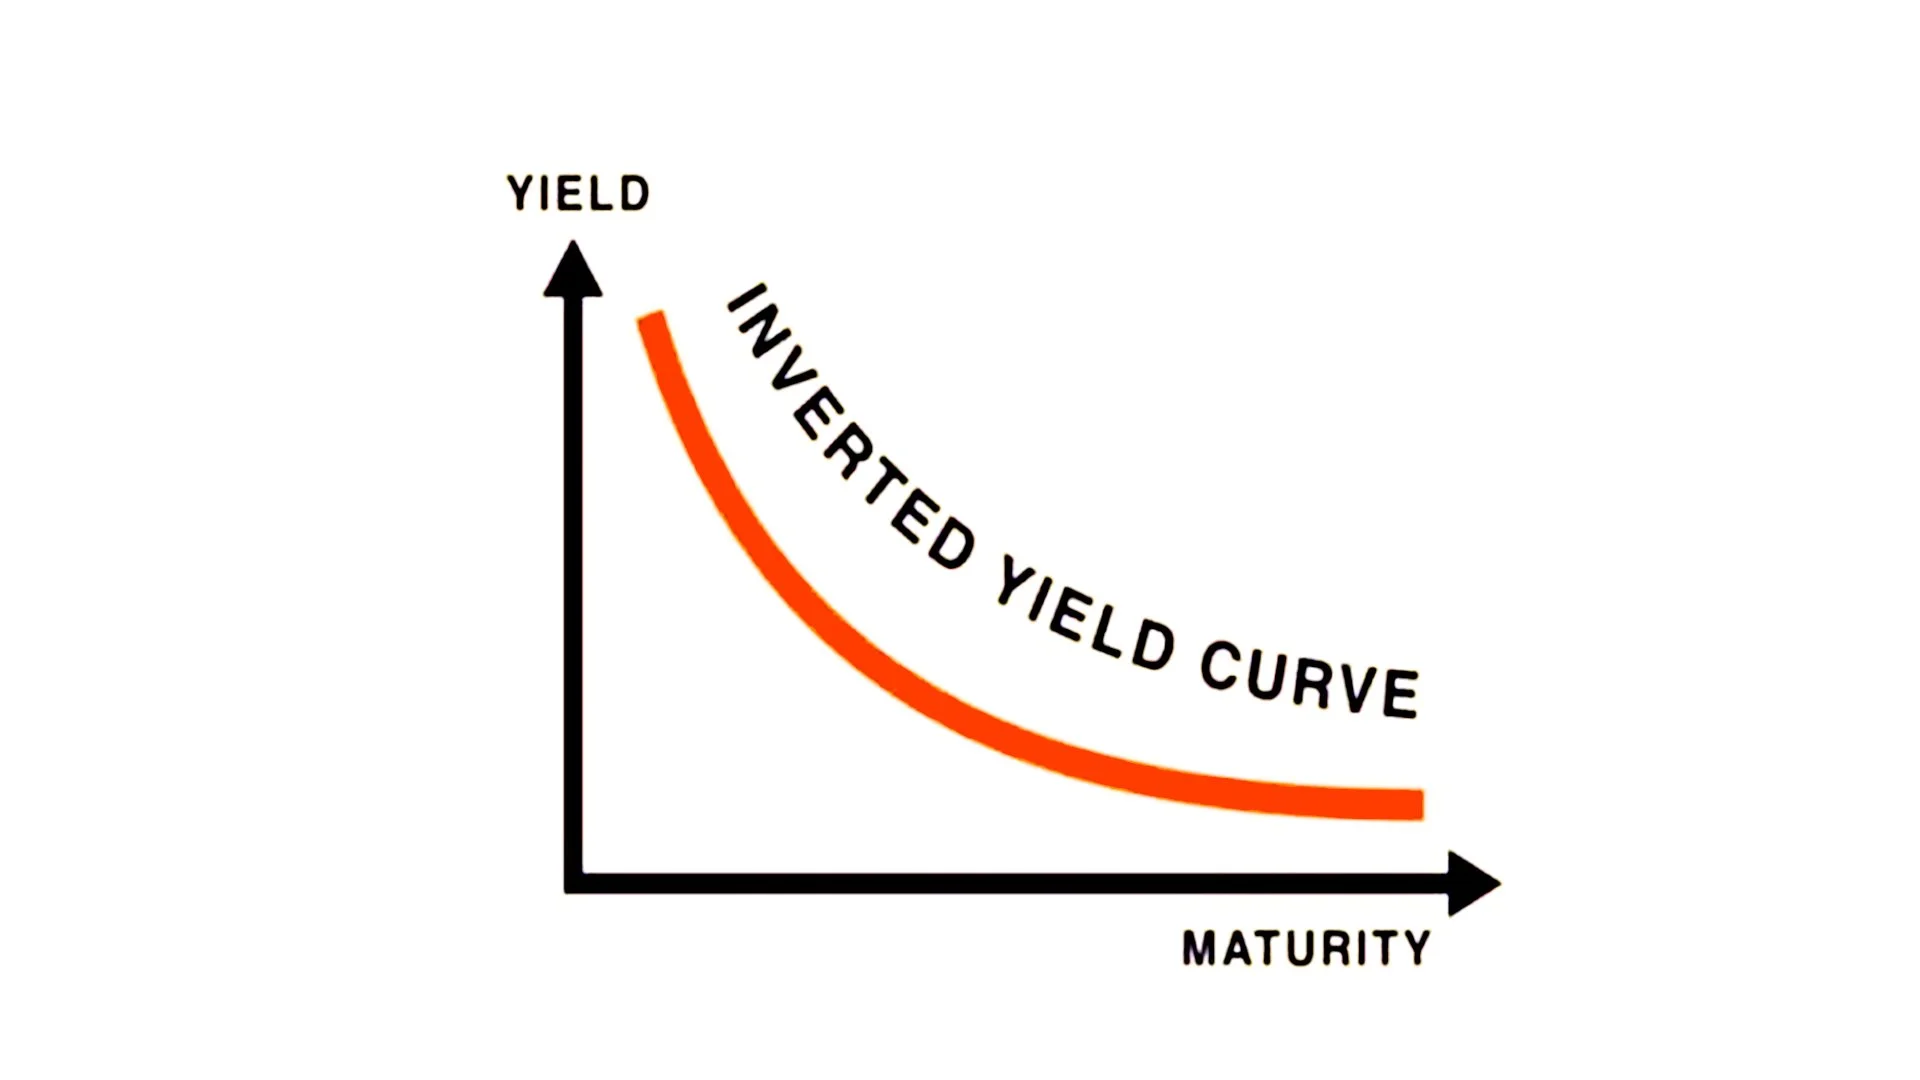
The Anatomy of a Normal vs. Inverted Curve
Under normal economic conditions, the yield curve slopes upward. This makes intuitive sense: if you lend money to the government for 10 years, you expect a higher interest rate (yield) than if you lend it for only 2 years. You are being compensated for the "time risk."
However, an Inverted Yield Curve occurs when short-term interest rates (like the 2-year Treasury) become higher than long-term rates (like the 10-year Treasury).
What is the market saying?
Short-Term Pessimism: Investors believe the central bank will keep rates high to fight inflation in the near term.
Long-Term Fear: Investors are so worried about a future slowdown that they rush to buy long-term bonds, driving their prices up and their yields down.
Why It Matters: The 100% Success Rate?
Historically, the yield curve inversion has been the most reliable "Recession Indicator" in the modern era. Since 1955, every single US recession has been preceded by an inversion of the 2-year and 10-year Treasury yields, with only one "false positive" in the mid-1960s.
As we look at the data in early 2026, the market is particularly sensitive to these signals. While the curve spent a record-breaking 16 months inverted between 2022 and 2024, the current "normalization" (where long-term rates rise back above short-term rates) is often the moment when the recession actually begins. At Global Markets Eruditio, we teach that the inversion is the warning, but the "un-inversion" is the trigger.
The Forex Impact: Trading the Inversion
In Forex Trading for Beginners, we learn that interest rates are the primary driver of currency value. An inverted curve creates a unique set of challenges and opportunities for currency pairs:
The USD Haven Effect: When the US curve inverts, it often signals a global slowdown. In times of fear, the US Dollar (USD) often strengthens as a "Safe Haven," even if the US is the source of the economic concern.
EUR/USD Volatility: An inversion in the US often puts pressure on the EUR/USD pair. As investors flee riskier European assets for the safety of US Treasuries, the Euro can struggle.
The Carry Trade Collapse: High short-term rates in a country with an inverted curve can temporarily attract capital, but as soon as the recession fears materialize, the "Carry Trade" (borrowing in low-yield currencies like JPY to buy high-yield ones) often unwinds violently, leading to massive spikes in pairs like GBP/JPY.
The Lag: Timing the Downturn
The biggest frustration for traders is the lag. A recession doesn't happen the day the curve inverts; it typically follows 6 to 24 months later.
This is where sophisticated analysis from institutions like the GME Academy becomes invaluable. Rather than panicking the moment the curve flips, professional traders look for "confluence"—checking the yield curve against other data points like the PMI reports we discussed earlier or labor market strength. If the curve is inverted and employment starts to fade, the probability of a recession jumps from a "possibility" to a "certainty."
Listening to the Bond Market’s Whisper
The inverted yield curve is not a guarantee of a crash, but it is the market’s way of saying "Proceed with Caution." For the Forex trader, it is a signal to tighten stop-losses, reduce leverage, and look for opportunities in safe-haven currencies.
Whether you are watching the Canadian Dollar for signs of a commodity slump or monitoring the USD for a safe-haven rally, the bond market remains the most honest indicator we have.
Don't Let the Markets Flip Your Portfolio. The yield curve is one of the most powerful tools in fundamental analysis, but it’s only one piece of the puzzle. If you want to learn how to combine bond market signals with price action to build a professional-grade strategy, we have the perfect opportunity for you.
Join our FREE Forex Workshop. Learn to read the hidden signals of the bond market and identify recession-proof trade setups before the rest of the world catches on.