

Inflation’s Mixed Signal: U.S. Producer Prices Rise 0.5% in January as Service Margins Jump
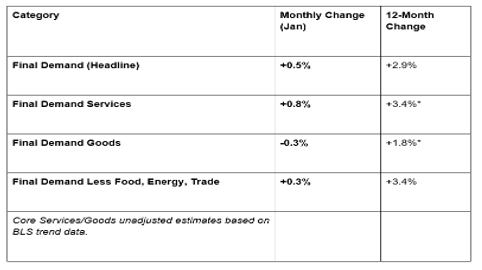
The U.S. Bureau of Labor Statistics reported on Friday, February 27, 2026, that the Producer Price Index (PPI) for final demand increased by 0.5% in January. While the headline figure suggests a heating up of inflationary pressures at the wholesale level, the underlying data reveals a sharp divergence between a surging services sector and a cooling goods market.
On an unadjusted basis, the index for final demand rose 2.9% for the 12 months ended in January 2026, a figure that remains a focal point for the Federal Reserve’s "higher for longer" interest rate strategy.
1. Services Surge vs. Goods Deflation
The January PPI increase was driven entirely by the services sector, which offset a notable decline in the cost of physical goods.
Services Spike: The index for final demand services advanced 0.8%, the largest jump since July 2025. This was primarily fueled by "trade services margins"—the difference between what wholesalers/retailers pay for goods and what they sell them for—which leaped 2.5%.
Goods Decline: Conversely, prices for final demand goods fell 0.3%. This was the largest drop in nearly a year, led by a significant 2.7% decrease in energy costs and a 1.5% dip in food prices.
The "Core" Constant: The index for final demand less foods, energy, and trade services (often called "Core-Core PPI") rose 0.3%, marking its ninth consecutive monthly increase and highlighting persistent underlying price pressure.
2. Product Detail: Gas Down, Wholesaling Up
The volatility in January’s report was concentrated in a few specific commodity and service categories:
The Downward Drivers: Nearly 80% of the decline in goods can be attributed to gasoline, which plummeted 5.5%. Other notable price drops included chicken eggs, electric power, and raw milk (which fell 9.8% at the intermediate level).
The Upward Drivers: A massive 14.4% jump in margins for professional and commercial equipment wholesaling accounted for over 20% of the total service increase. Additionally, "search, detection, and navigation systems" saw a staggering 15.5% price spike, likely reflecting high demand in the defense and aerospace sectors.
3. Intermediate Demand: The "Pipeline" Report
Prices for the different "stages" of production provide a look at what consumers might face in the coming months.
Stage 4 (Near Final): Advanced 0.4%, the ninth straight increase, suggesting that service-related costs (like staffing and retail rents) are still being passed down the line.
Unprocessed Goods: These fell 0.5%, driven by a 3.5% drop in foodstuffs. This indicates that while "factory gate" prices are rising, the raw agricultural and energy inputs are currently providing some relief to the supply chain.

GME Academy Analysis: "The Margin Trap"
At Global Markets Eruditio, we believe the January PPI report is more "hawkish" than the headline suggests.
Trader's Takeaway for February/March 2026:
Fed Policy: The 0.8% surge in services is exactly what the Federal Reserve does not want to see. Since services are labor-intensive, this suggests that wage pressures are still being successfully passed on to buyers via higher margins. This likely delays any talk of a Fed rate cut until late Q3.
Equity Impact: Higher trade margins are a double-edged sword. While they suggest strong pricing power for wholesalers and retailers (bullish for retail stocks), they also signal that inflation is "sticky," which keeps bond yields high and pressures tech valuations.
Currency (USD): The 2.9% annual PPI print keeps the U.S. Dollar supported. When wholesale inflation remains firm, it prevents the "real" interest rate from falling, making the Greenback more attractive than the Euro or Yen in the short term.
Join our FREE Macro Workshop at Global Markets Eruditio!
Are margins reaching a breaking point? We’ll analyze the PPI Trade Service Jump and show you how to trade the S&P 500 as the "Services Inflation" narrative takes hold.