

Trend-Following vs. Mean-Reversion: Choosing Your Algorithmic Edge
In the competitive world of algorithmic trading, most strategies fall into two opposing philosophical camps: Trend-Following and Mean-Reversion. As of February 2026, market volatility has made the distinction between these two even more critical for retail and institutional traders alike.
While a trend-following algorithm seeks to profit from a "body in motion," a mean-reversion algorithm bets on a "rubber band" effect—that a price stretched too far must eventually snap back to its average. Understanding which one fits your personality and the current market regime is the first step toward long-term profitability.
1. Trend-Following: "The Trend is Your Friend."
Trend-following (or momentum) algorithms assume that if a price is moving in a specific direction, it is likely to continue that way. These bots don't try to predict when a trend will start; they simply wait for confirmation and "ride the wave."
Core Logic: Buy "high" and sell "higher" (or sell "low" and buy "lower").
Key Indicators: Moving Average Crossovers (e.g., 50/200 SMA), Donchian Channels, and Breakout levels.
Win Rate: Typically low (30%–45%). These systems "kiss a lot of frogs," enduring small, frequent losses while waiting for the one "home run" trade that covers all previous drawdowns.
2. Mean-Reversion: "Buy the Dip, Sell the Rip."
Mean-reversion algorithms operate on the statistical theory that asset prices orbit around a long-term average. When the price deviates significantly from this mean—due to news, emotional selling, or a "fat finger" trade—the algorithm bets on a return to normalcy.
Core Logic: Buy "low" and sell "average" (or sell "high" and buy "average").
Key Indicators: Bollinger Bands, RSI (Relative Strength Index), and Z-score (Standard Deviation).
Win Rate: Typically high (60%–80%). These systems provide consistent, modest profits in range-bound markets but face "tail risk"—sudden, violent losses if a market stops reverting and starts a new trend.
3. Side-by-Side Comparison
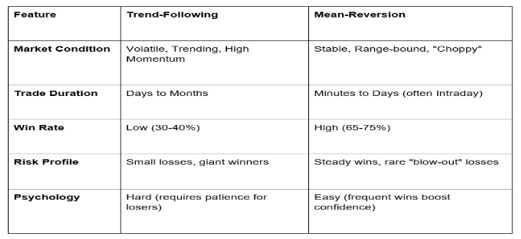 https://images.squarespace-cdn.com/content/619b666b5842697e2af69258/a9d57b27-4fad-4532-874a-89133d6a85bc/P477.02.jpg?content-type=image%2Fjpeg
4. The Hybrid Approach: Combining Both
In 2026, the most resilient algorithmic systems are often Hybrid Models. Because markets rotate between regimes—trending for 30% of the time and ranging for 70%—running only one strategy can lead to long periods of "flat" equity curves.
How a Hybrid System Works:
Regime Filter: An algorithm first checks the Average Directional Index (ADX). If ADX is above 25, the system activates its Trend-Following module.
Range Mode: If ADX is below 20 (indicating a sideways market), the system switches to Mean-Reversion logic to harvest small gains from the chop.
Volatility Adjustment: The system uses the ATR (Average True Range) to size positions differently depending on which module is active.


The GME Academy Analysis: "Trade the Market, Not the Idea"
At Global Markets Eruditio, we often see beginners fall in love with a single bot. However, as the USD/JPY trend in early 2026 proved, even the best mean-reversion bot can be "steamrolled" by a macro-driven trend that refuses to snap back.
The Strategy for 2026:
If you are new to algos, start with Mean-Reversion on lower timeframes (15-minute charts) to get a feel for how prices oscillate. However, keep a Trend-Following bot running on a daily timeframe to catch the "big moves" that define the year. Diversifying across strategies is just as important as diversifying across assets.
Join our FREE Forex Workshop at Global Markets Eruditio!
Not sure which style fits you? We’ll run your trading history through our "Strategy Analyzer" to see if you're a natural trend follower or a mean-reversion specialist.