

Is the American Dream Stalling? What October’s Housing Data Reveals About the US Dollar
While most traders are glued to the latest inflation prints or employment numbers, the "bedrock" of the American economy—the housing market—is sending subtle signals that could dictate the next major move for the US Dollar (USD). On January 13, 2026, the U.S. Census Bureau and HUD released the new residential sales figures for October 2025, painting a picture of a market that is remarkably resilient yet undergoing a significant structural shift.
At Global Markets Eruditio, we teach our students that housing is a "leading indicator." When people buy homes, they buy furniture, appliances, and insurance—sparking a chain reaction of economic activity. For those diving into Forex trading for beginners, understanding these reports is essential for predicting the long-term health of the US Dollar.

The 737,000 Headline: A Market in Equilibrium?
In October 2025, sales of new single-family houses reached a seasonally adjusted annual rate of 737,000. This figure represents a minor 0.1 percent dip from September’s rate of 738,000. While the month-on-month change was virtually flat, the year-on-year comparison is where the real story lies: sales are up a massive 18.7 percent compared to October 2024.
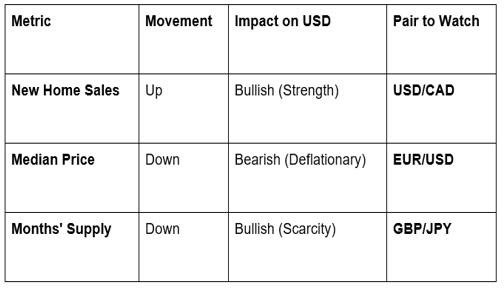
This surge from the previous year suggests that despite higher interest rates, demand for new inventory remains robust. In Forex trading, a strong housing market often supports a "hawkish" stance from the Federal Reserve, as it indicates the economy can handle tighter monetary policy. This, in turn, often leads to a bullish outlook for the USD against peers like the Canadian Dollar (CAD).
Inventory and the "7.9 Month" Supply Chain
The report also highlighted that there were 488,000 new houses for sale at the end of October. This represents a 7.9 months' supply at the current sales rate. While this is unchanged from September, it is 15.1 percent lower than the supply seen in October 2024 (which sat at 9.3 months).
A supply of 7.9 months is generally considered "healthy" to "slightly oversupplied" (a balanced market is typically 6 months). However, the sharp decline in supply from the previous year suggests that builders are finally starting to clear out the backlog of inventory.
For a Forex trader, this balance is a "Goldilocks" scenario. It’s not so tight that it’s causing hyper-inflation in housing, but it’s not so loose that it suggests an economic crash. This stability often leads to lower volatility in the EUR/USD pair, as it reduces the likelihood of emergency central bank interventions.
The Price Paradox: Why Median Prices are Slipping
One of the most intriguing data points in the October report was the median sales price. The median price of new houses sold was $392,300—a 3.3 percent drop from September and a significant 8.0 percent decline from October 2024’s price of $426,300.
In contrast, the average sales price rose to $498,000. What does this divergence tell us?
Downsizing: Builders are likely focusing on smaller, more affordable "starter" homes to attract buyers.
Incentives: To keep the USD flowing, developers may be offering price cuts or mortgage rate buy-downs.
From a Forex education perspective at GME Academy, this price drop is actually a deflationary signal. If housing prices continue to cool, it may give the Federal Reserve more room to eventually pause or cut interest rates. This is a critical development for those trading cross-economy news, as a shift in US interest rate expectations can send the GBP/JPY or EUR/USD into massive new trends.


How Housing Data Moves the Forex Market
New home sales are a high-impact data point because they represent a significant capital commitment. Here is how you can use this data in your Forex trading strategy:
When US housing data outperforms expectations, the US Dollar typically strengthens as it signals a "soft landing" for the economy. Conversely, if sales were to crater, we might see the CAD or Euro gain ground as traders bet on a US recession.
Building Your Edge with GME Academy
In the world of Forex trading for beginners, it is easy to get lost in the sea of numbers. The October housing report is a perfect example of why fundamental analysis is the "secret sauce" of professional trading. You aren't just looking at a price on a screen; you are looking at the health of the American family and the strength of the global reserve currency.
At Global Markets Eruditio, we specialize in helping you connect these dots. We move beyond the basic "buy/sell" signals and teach you how to read the economic tea leaves that the big banks use to move billions of dollars every day.
Don't Just Watch the Market—Understand It
The housing market is shifting, and the US Dollar is reacting. Are you prepared for the next wave of volatility in the EUR/USD or GBP/JPY?
Join our FREE Forex Workshop this week! Our senior analysts at GME Academy will break down the latest US housing trends and show you exactly how to position your trades for the coming month.