

The Energetic Pulse: Energy Prices and Currency Correlations
In the global markets of 2026, energy prices are no longer just "input costs"—they are the primary drivers of currency strength and central bank policy. As oil and natural gas markets face a structural oversupply this year, the traditional correlations that traders relied on for decades are shifting.
At the GME Academy, we focus on the "terms of trade" (the ratio of export prices to import prices). When energy prices move, they create winners (Exporters) and losers (Importers) in the FX world.
1. The "Petro-Currencies": CAD and NOK
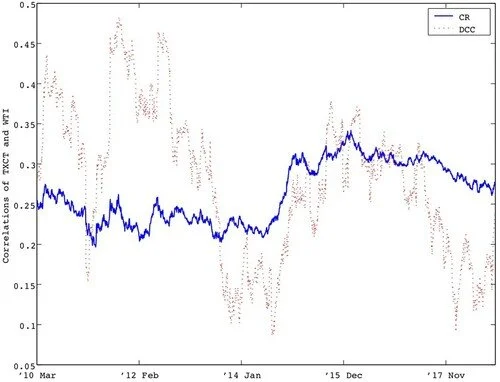
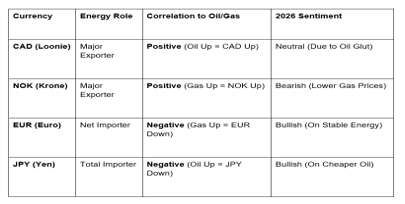
Countries like Canada and Norway are the world's premier "energy exporters." Their currencies—the Canadian Dollar (CAD) and Norwegian Krone (NOK)—exhibit a strong positive correlation with crude oil (WTI and Brent).
The 2026 Outlook: Forecasters, including the World Bank and major analysts, project Brent Crude to fall toward the $50–$60 range in 2026 due to an "oil glut" and sluggish global growth.
The Impact: As oil prices slide, the USD/CAD pair typically rises (meaning the CAD weakens). Lower oil revenues reduce Canada’s trade surplus and dampen the domestic economic outlook, potentially forcing the Bank of Canada to remain more "dovish" than the US Federal Reserve.
The Catch: Some analysts suggest that while the CAD is still an energy play, its correlation has weakened slightly as Canada diversifies its economy. Interestingly, the Swiss Franc (CHF) has emerged as an occasional "shadow proxy" for energy stability due to its safe-haven status during energy crises.
2. The Net Importers: EUR and JPY
For energy-hungry economies like the Eurozone and Japan, the relationship is inverse. Higher energy prices act like a "tax" on their economies, weakening their currencies.
Euro (EUR) and Natural Gas: The Euro is particularly sensitive to TTF (European) Natural Gas prices. In early 2026, natural gas prices have shown signs of stabilization due to record-high storage levels and a massive wave of new LNG supply from North America and Qatar.
Japanese Yen (JPY) and Crude: Japan imports nearly all of its energy. When oil prices drop toward $50, the JPY often finds structural support because the country’s "import bill" shrinks, improving its trade balance.
3. The Energy-Dollar Dynamic
The relationship between the US Dollar (USD) and energy is the most complex "seesaw" in the market.
The Pricing Mechanism: Because oil is priced in USD, a stronger dollar usually makes oil more expensive for the rest of the world, which can lead to a drop in demand and, consequently, lower oil prices (Negative Correlation).
The 2026 Shift: The US is now a massive net exporter of both oil and natural gas. This means that, unlike the 1990s, high energy prices can sometimes strengthen the USD because they boost US trade revenues.
4. Inflation and Central Bank "Second-Round" Effects
Energy prices aren't just about trade balances; they are the "spark" for inflation.
Rising Energy: Leads to higher transportation costs -> Higher CPI -> Central Banks hike rates -> Currency strengthens.
Falling Energy (2026 Trend): As energy prices are forecast to decline by 7-10% this year, they are contributing to global disinflation. This gives central banks the "green light" to stop hiking or begin cutting rates, which can remove the "yield support" for a currency.


The GME Academy Analysis: "Trading the Glut"
At Global Markets Eruditio, we believe the "Energy Glut of 2026" provides a unique window for Long-JPY and Long-EUR trades against the commodity currencies.
Trader's Takeaway:
Watch the IEA Reports: The International Energy Agency (IEA) recently highlighted that the "LNG wave" is rebalancing markets. If natural gas stays low, the Euro could see a multi-month recovery.
Shorting the Petro-Laggards: If Brent Crude breaks below $50, watch for USD/CAD to target 1.4000 as the "oil drag" outweighs Canada's domestic growth.
The Geopolitical "Pop": Always have a stop-loss. While the baseline is an "oversupply," a single geopolitical shock in the Middle East can flip these correlations overnight, sending Oil and Gold up together.
Join our FREE Forex Workshop at Global Markets Eruditio!
Is your portfolio ready for $50 oil? We’ll show you how to set up an Oil/CAD Correlation Dashboard in MT5 so you can spot the "divergence" before the market corrects.