

The Market’s Invisible Walls: How Support, Resistance, and Structure Reveal Forex Secrets
Seeing the Market Beyond the Chart
Every trader, whether new or seasoned, has seen the zigzags of a Forex chart — but few understand the deeper story those movements tell. Beneath every swing, rally, or pullback lies an invisible framework: support, resistance, and market structure.
At GME Academy (Global Markets Eruditio), we call this framework the “skeleton of price.” When you understand it, you stop reacting to random moves — and start anticipating where the market wants to go next.
Support and Resistance: The Market’s Boundaries
Think of support as the “floor” where price tends to stop falling, and resistance as the “ceiling” where price often stops rising. These are zones where market psychology plays out in real time — where buyers and sellers fight for control.
Support: Where Buyers Step In
Support levels form when a currency pair, like EUR/USD, repeatedly bounces from a specific price zone. This happens because traders see value there — they believe the pair is “cheap” and start buying, pushing price back up.
Resistance: Where Sellers Take Over
Resistance forms when price rises to a level where traders believe it’s “too expensive.” Sellers begin to dominate, as seen in pairs like USD/JPY near psychological levels like 150.00, causing price to retreat.
But these levels aren’t always precise. They’re often zones, not exact lines — areas where liquidity pools gather and institutions place large pending orders. That’s why markets often “wick” slightly beyond these zones before reversing — a phenomenon known as a liquidity grab or stop hunt.
Market Structure: The DNA of Price Movement
While support and resistance show where price reacts, market structure tells you why and how it’s moving.
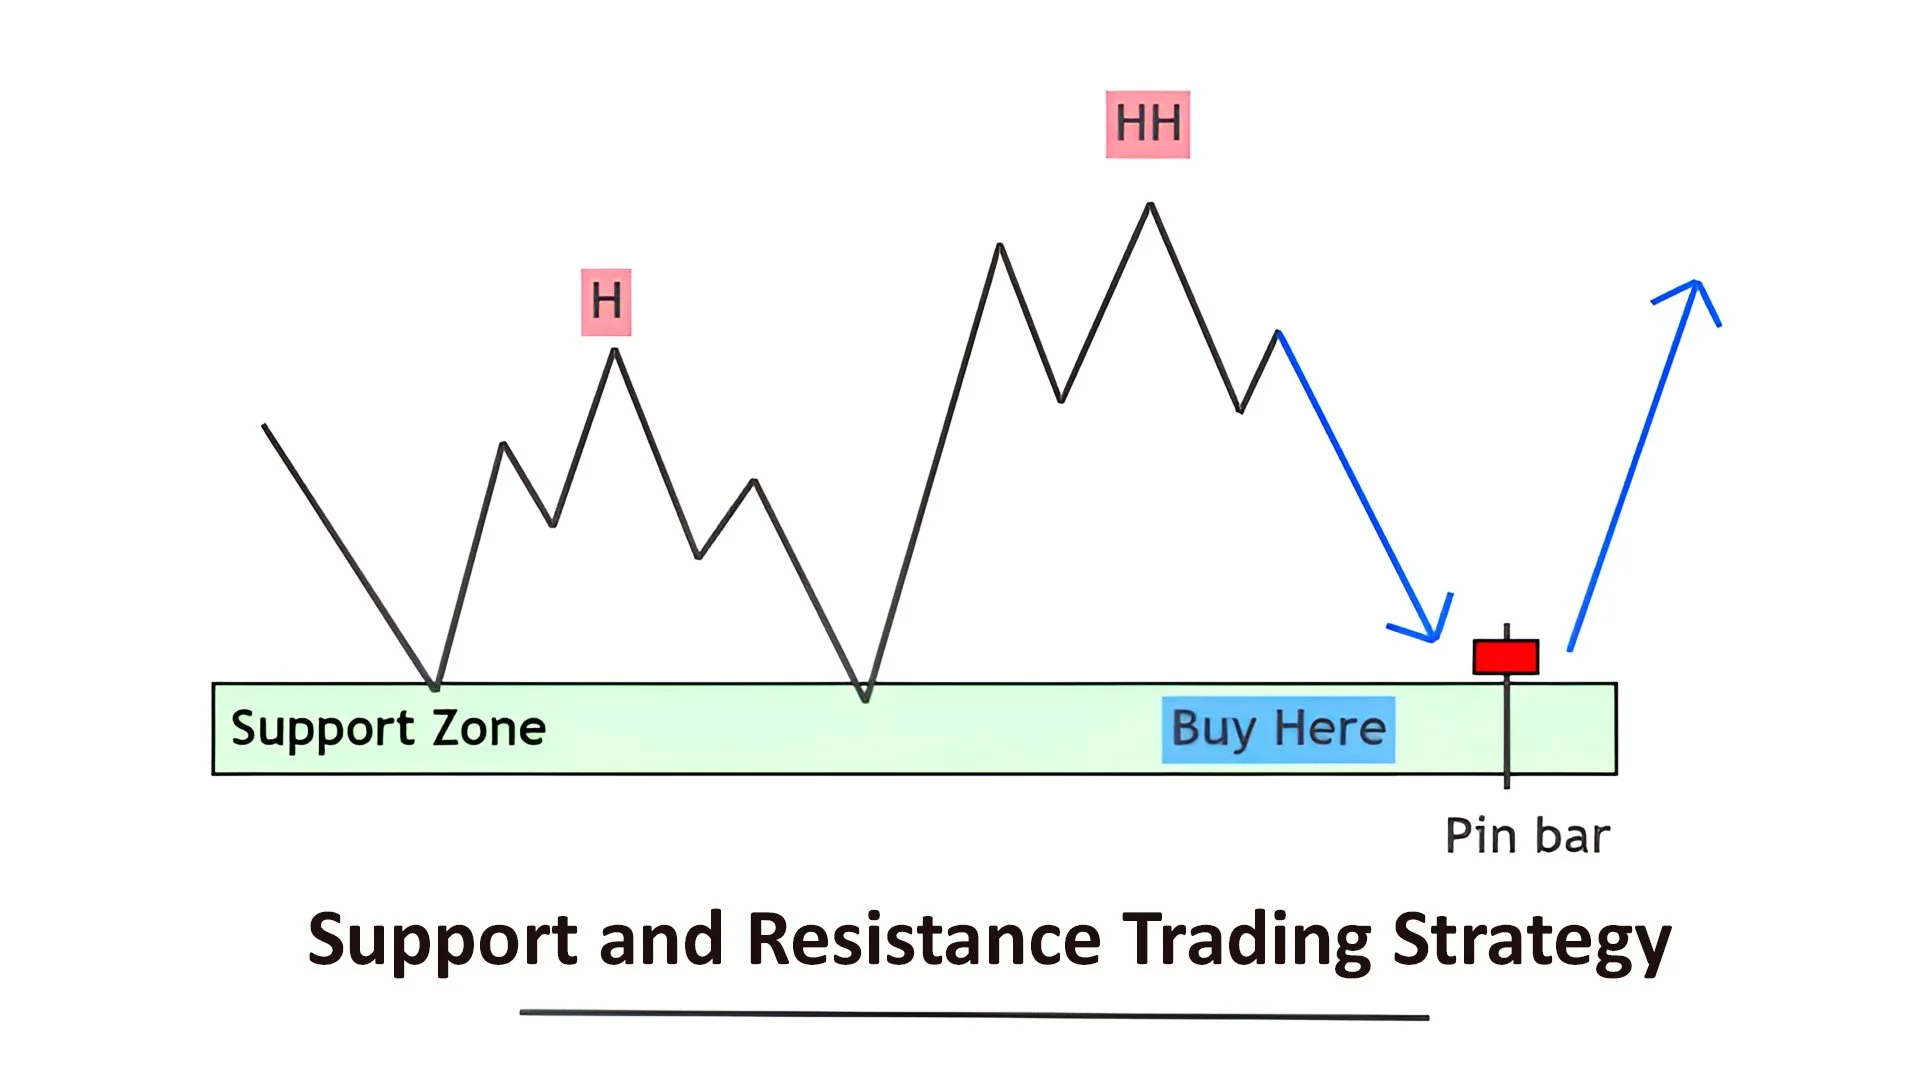
It’s the overall shape and rhythm of the market — the sequence of higher highs (HH), higher lows (HL), lower highs (LH), and lower lows (LL) that reveal the trend’s direction.
1. Uptrend (Bullish Structure)
When price forms higher highs and higher lows, buyers dominate. Example: GBP/USD making steady gains after strong UK GDP data.
2. Downtrend (Bearish Structure)
Lower highs and lower lows indicate sellers in control. Example: USD/CAD falling amid weaker U.S. manufacturing data.
3. Range (Consolidation)
When neither side wins, the price moves sideways — bouncing between support and resistance levels. This is often where traders prepare for the next breakout.
Understanding this “market map” helps traders time entries, exits, and stop losses more effectively. Instead of guessing, they align trades with the structure — buying dips in uptrends or selling rallies in downtrends.

Why These Concepts Matter in Forex Trading
Most beginners lose trades not because their strategy fails, but because they trade against structure.
For example:
Buying at resistance because the chart “looks bullish”
Selling at support out of fear of further drops
Ignoring trend structure and entering mid-swing
These errors often lead to unnecessary losses.
At Global Markets Eruditio, we teach traders to identify where smart money enters — institutional order blocks — which usually align with key structural levels.
Combining structure with other tools like moving averages or Fibonacci retracements can help confirm zones of interest and improve accuracy.
Real-World Application: EUR/USD Example
Imagine EUR/USD trending upward, forming a sequence of higher highs and higher lows. Traders can draw support around 1.0650 — a zone tested multiple times — and resistance near 1.0750.
If price breaks above 1.0750 with momentum, it signals a bullish structure continuation. But if price drops and closes below 1.0650, that’s a structure break, hinting at a possible trend reversal.
Such analysis gives traders a clear framework to plan trades logically instead of emotionally.

Combining Structure with Liquidity Awareness
Market structure and liquidity go hand in hand.
Institutions often drive prices toward liquidity pools — areas where retail traders’ stop losses accumulate. These zones usually sit above resistance or below support.
By recognizing how these traps form, you can avoid getting “stop hunted” and instead trade with institutional flow, a key focus in GME Academy’s advanced modules.
Master the Framework of Price
Support, resistance, and structure aren’t just trading tools — they’re the language of the market. Once you learn to read them, every price move starts to make sense.
If you’re serious about mastering Forex trading from the inside out, it’s time to go beyond patterns and indicators.
Take the Next Step: Join Our Free Forex Workshop
Learn how to read market structure like a pro and identify where institutional money is flowing.
Join our FREE Forex Workshop with GME Academy and start building confidence in your trades through real-world strategy and guided learning.
Reserve your slot today and transform the way you see the Forex market.