

The Bollinger Band Squeeze: How to Predict the Market’s Next Explosive Move
Volatility is the lifeblood of the financial markets, yet it remains the most misunderstood concept for those just starting out in Forex trading. While most traders fear a quiet market, professionals at Global Markets Eruditio know that a period of low volatility is simply the "calm before the storm."
The Bollinger Bands Squeeze is perhaps the most reliable indicator of an impending price explosion. By understanding how to read these bands, you can stop reacting to the market and start anticipating it.
 https://images.squarespace-cdn.com/content/619b666b5842697e2af69258/a9d57b27-4fad-4532-874a-89133d6a85bc/P477.02.jpg?content-type=image%2Fjpeg
The Anatomy of the Squeeze
Developed by John Bollinger, these bands consist of a simple moving average (the middle line) and two outer bands that represent standard deviations of price.
The Expansion: When the market is volatile, the bands widen.
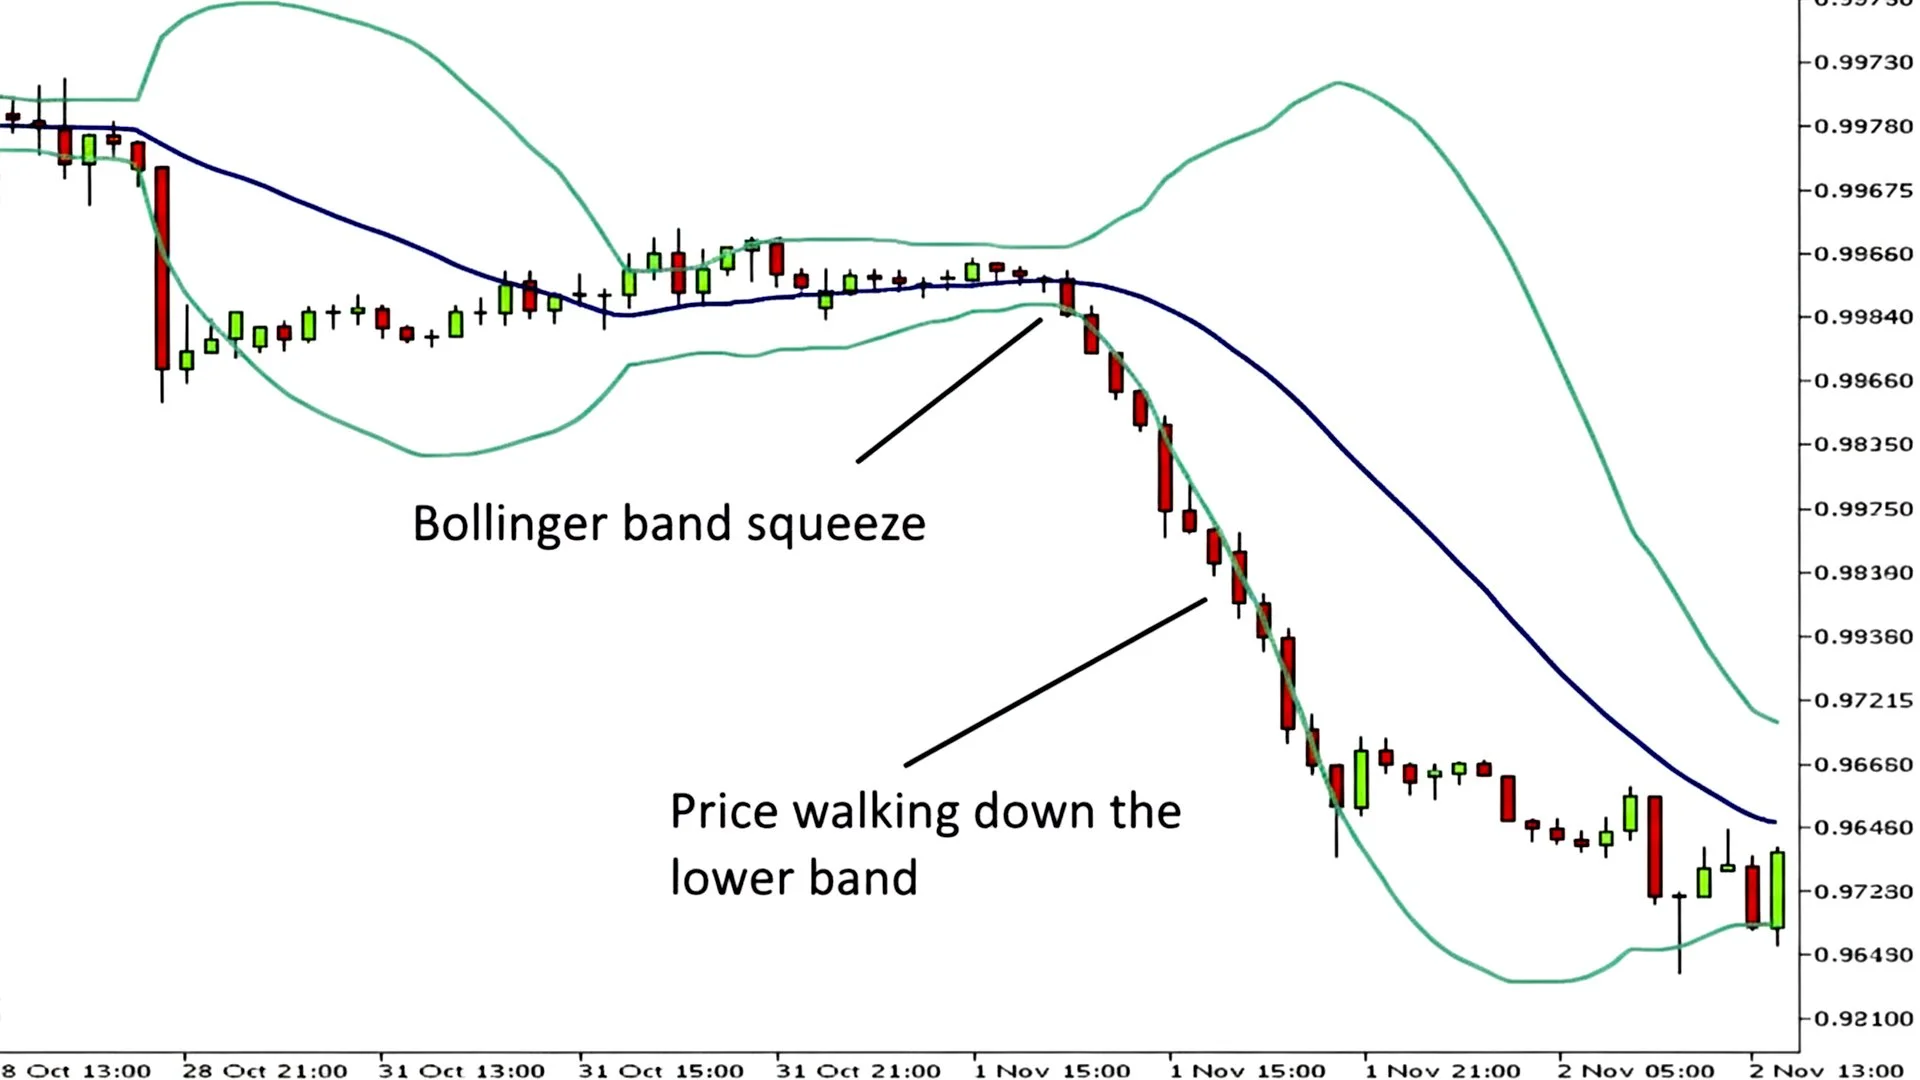
The Squeeze: When the market enters a period of consolidation—such as when the US Dollar is waiting for a major economic report—the bands contract.
When the distance between the upper and lower bands reaches a relative six-month low, the "Squeeze" is on. This indicates that the market is "coiling" like a spring. At GME Academy, we teach our students that the longer the squeeze, the more violent the eventual breakout is likely to be.
Trading the Breakout: EUR/USD and CAD Examples
The Squeeze doesn't tell you which direction the price will go; it simply tells you that a massive move is imminent. To trade this effectively, you must watch for a candle to close outside the bands.
1. The Bullish Breakout
Imagine the EUR/USD has been trading in a tight range for several days. Suddenly, a high-volume green candle closes above the upper Bollinger Band. This is your signal that the bulls have won the tug-of-war. If this aligns with positive Eurozone news, the momentum can carry the pair for hundreds of pips.
2. The Bearish Breakdown
Conversely, watch the CAD or USD/CAD during a squeeze. If the price closes below the lower band, it suggests a surge in selling pressure. Because Forex trading for beginners often involves chasing moves that have already happened, the Squeeze allows you to enter at the very start of a new trend.
Avoiding the "Head Fake"
The biggest risk in a breakout strategy is the "Head Fake"—where the price momentarily breaks one way, only to reverse and rocket in the opposite direction.
To filter these out, the experts at Global Markets Eruditio recommend using a secondary indicator, such as the Relative Strength Index (RSI) or Volume. If the GBP/JPY breaks the upper band but the RSI is showing a bearish divergence, stay cautious. A true breakout should be supported by a surge in momentum.
Why Strategy Beats Luck
Success in Forex isn't about predicting the future; it's about managing your risk when the odds are in your favor. The Bollinger Band Squeeze provides a clear, mathematical reason to enter a trade, removing the emotional guesswork that plagues most retail traders.
Whether you are focusing on single-economy news affecting the US Dollar or the complex interactions of currency pairs like EUR/USD, mastering the Squeeze gives you a professional edge.
Take Your Strategy to the Next Level
Understanding the Squeeze is the first step toward becoming a consistently profitable trader. However, seeing it on a chart and executing it in real-time are two different skills. At GME Academy, we specialize in bridging that gap through hands-on education.
Ready to see the Squeeze in action? Join our FREE Forex workshop and learn how to master breakouts, manage your risk, and trade like a professional!