

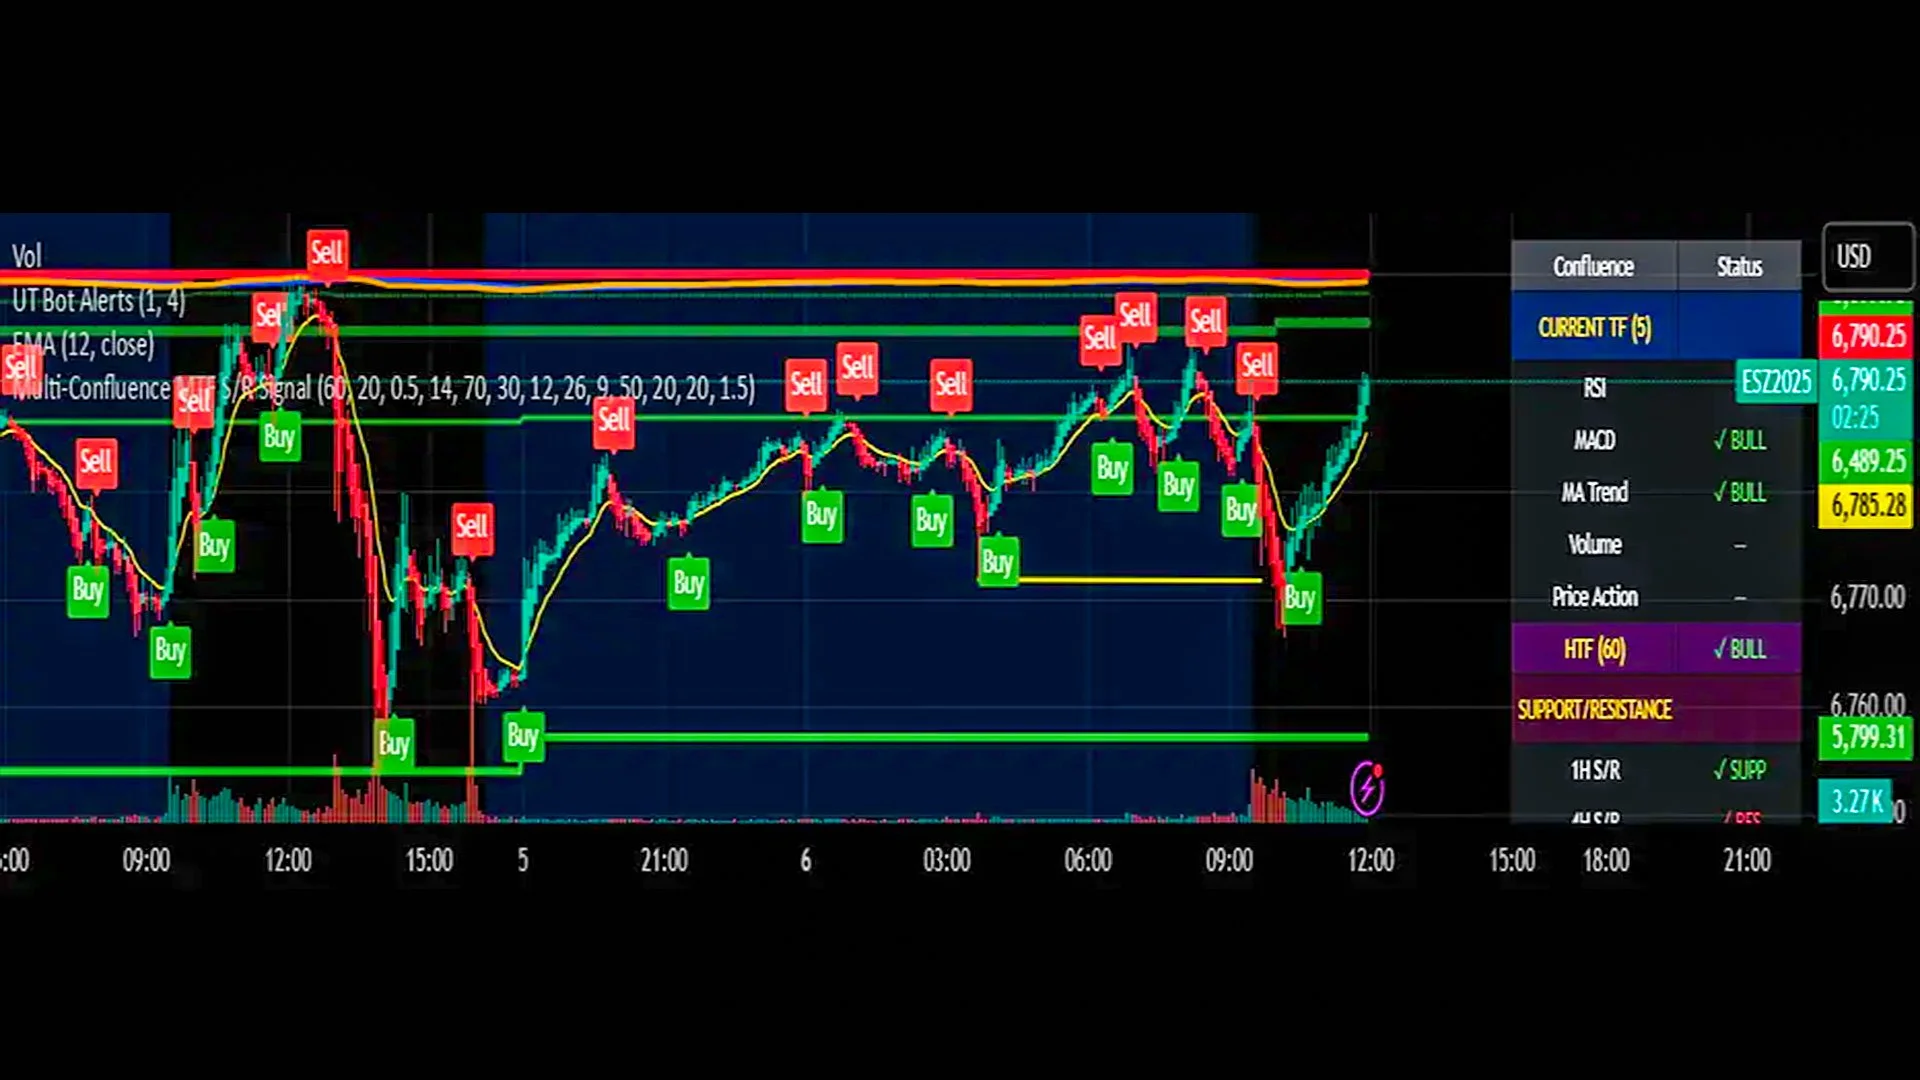
The Power of the "Perfect Storm": Understanding Confluence
In the high-stakes world of currency markets, relying on a single signal is often like trying to navigate a storm with a compass but no map. To truly master the art of market analysis, professional traders turn to a concept known as Confluence.
At its core, Multi-Indicator Confluence is the strategic alignment of several independent technical or fundamental tools to validate a single trade idea. Think of it as a jury trial: one witness (indicator) might be mistaken, but when four witnesses provide the same testimony, the verdict becomes far more reliable.
For those engaging in Forex trading for beginners, the initial impulse is often to find the "Holy Grail" indicator. However, seasoned experts at Global Markets Eruditio understand that no single tool is infallible. By combining different classes of indicators, you filter out market noise and significantly increase your "win" probability.
 https://images.squarespace-cdn.com/content/619b666b5842697e2af69258/a9d57b27-4fad-4532-874a-89133d6a85bc/P477.02.jpg?content-type=image%2Fjpeg
The Triple-Threat Framework: Selecting Your Tools
To avoid "analysis paralysis," you shouldn't just stack any indicators. You need tools that measure different market dimensions. A robust confluence setup typically involves three categories:
1. Trend Identification (The Compass)
Before you look for a signal, you must know the dominant direction of the market.
The Tool: Moving Averages (e.g., 50-period and 200-period).
The Signal: If the US Dollar (USD) is trading above its 200-day EMA, the bias is bullish. You should only look for "Buy" confluences.
2. Momentum & Overbought/Oversold (The Speedometer)
Once the trend is clear, you need to know if the price has moved too far, too fast.
The Tool: Relative Strength Index (RSI) or Stochastic Oscillator.
The Signal: If you are looking at the EUR/USD and the price hits a key resistance level while the RSI is above 70, you have a confluence of resistance and an overbought condition.
3. Volatility & Structural Levels (The Barrier)
Finally, you need to see where the "walls" are in the market.
The Tool: Bollinger Bands or Fibonacci Retracement levels.
The Signal: A touch of the lower Bollinger Band often acts as a springboard, especially when it aligns with a historical support level.
Real-World Application: Trading the Cross-Economy News
Confluence isn't just about lines on a chart; it’s about how those lines react to the real world. Imagine a scenario involving the Canadian Dollar (CAD).
If Canada releases positive employment data (Fundamental Signal), and at the exact same time, the USD/CAD pair hits a major psychological resistance level like 1.3500 (Structural Signal), and your MACD shows a bearish crossover (Technical Signal), you have a high-probability "Short" opportunity.
By waiting for the technicals to align with the Forex fundamentals, you move from "guessing" to "strategizing."
Avoiding the "Cluttered Chart" Trap
A common mistake in Forex trading is using indicators that tell you the same thing. For example, using the RSI, Stochastics, and Williams %R simultaneously is redundant because they are all momentum oscillators. If one is overbought, they likely all are.
Instead, seek a "lean" confluence:
One Trend Filter: (e.g., 200 EMA)
One Momentum Filter: (e.g., RSI)
One Volatility/Structure Filter: (e.g., Daily Pivot Points)
Elevate Your Strategy with GME Academy
Mastering confluence is the bridge between being a retail hobbyist and a professional market participant. It requires patience to wait for the "stars to align," but the reward is a trading plan built on evidence rather than emotion.
At Global Markets Eruditio, we specialize in breaking down these complex institutional techniques into actionable steps for everyday traders. Whether you are navigating the volatility of GBP/JPY or seeking stability in the US Dollar, the principles of confluence remain your greatest ally.
Ready to See Confluence in Action?
Don't navigate the markets alone. We invite you to take the next step in your professional development.
Join our FREE Forex Workshop today and learn the exact multi-indicator blueprints used by our lead analysts to find high-probability setups in real-time.