

Beyond the Candlestick: Mastering Volume and Market Profile in Forex
In the fast-paced world of Forex Trading, most beginners start with traditional vertical volume bars and standard candlesticks. However, professional traders often look "inside" the price action to understand where the real battle between bulls and bears is happening. This is where Volume Profile and Market Profile come into play.
At Global Markets Eruditio, we emphasize that price is simply an advertisement, while volume and time are the truth. Understanding these tools allows you to identify "Fair Value" and predict where the US Dollar or major currency pairs might head next with much higher precision.
 https://images.squarespace-cdn.com/content/619b666b5842697e2af69258/a9d57b27-4fad-4532-874a-89133d6a85bc/P477.02.jpg?content-type=image%2Fjpeg
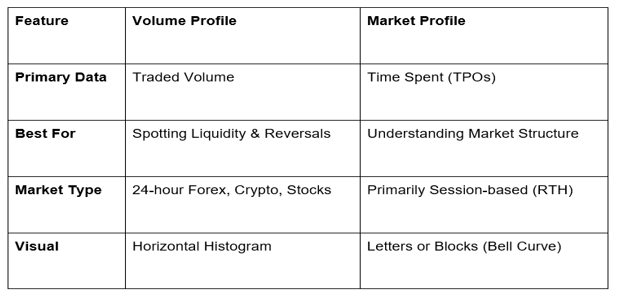
Volume Profile vs. Market Profile: What’s the Difference?
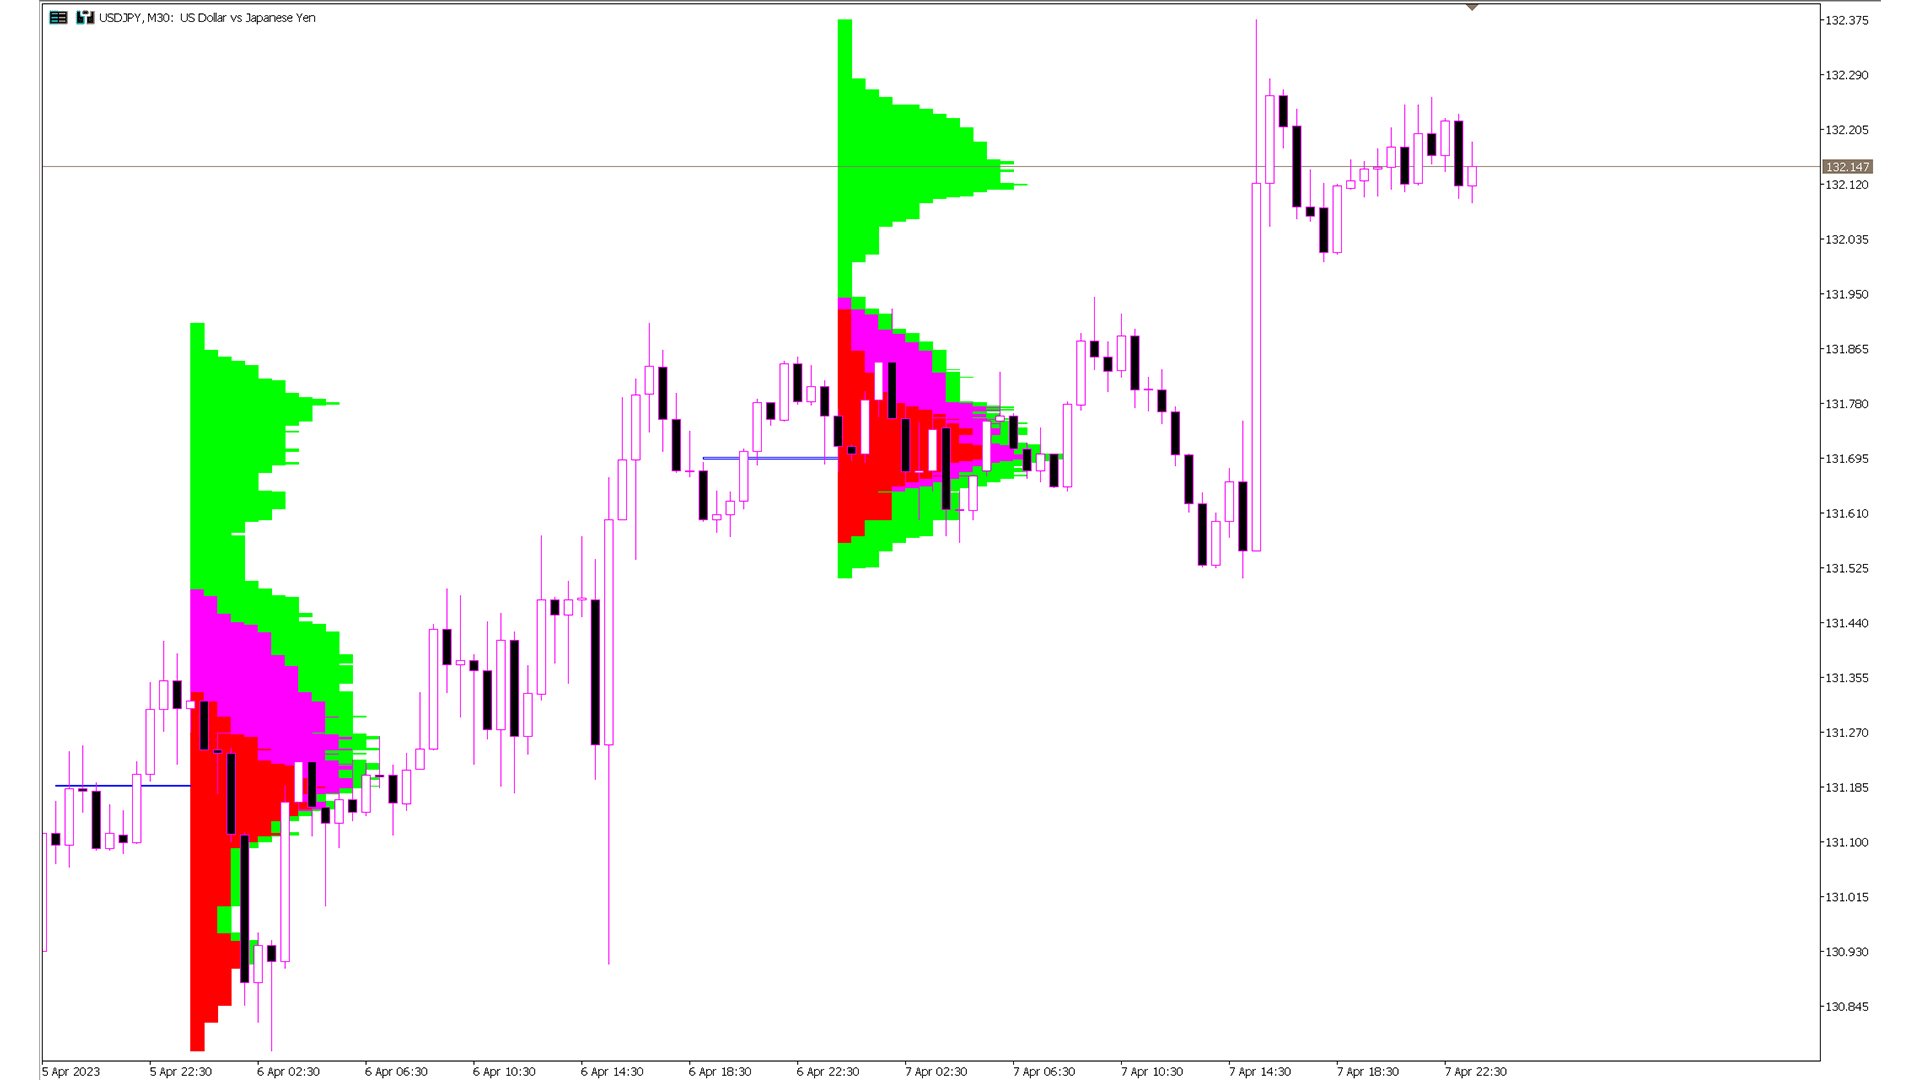
While they look similar—appearing as horizontal histograms on the side of your chart—they measure fundamentally different things.
Volume Profile: Measures Volume at Price. It tells you exactly how much capital was committed at a specific price level. It identifies where the "Big Money" or institutional players are active.
Market Profile (TPO): Measures Time at Price. It uses Time Price Opportunities (TPOs) to show how long the market spent at a certain level. It reveals what price the market "accepted" as fair value over a specific period.
For Forex Trading for Beginners, think of it this way: Volume Profile shows the intensity of the fight, while Market Profile shows the duration of the agreement.
Key Components You Must Know
Both profiles share a few critical markers that act as "magnets" or "barriers" for price:
Point of Control (POC): The price level where the most activity occurred. In Volume Profile, it’s the price with the most volume (VPOC); in Market Profile, it’s where the most time was spent.
Value Area (VA): The range where 70% of the trading activity took place. This is considered the "fair price" zone for that session.
High Volume Nodes (HVN): "Thick" areas where price tends to slow down and consolidate. These act as strong support and resistance.
Low Volume Nodes (LVN): "Thin" areas where little trading occurred. Price often "zips" through these zones quickly, making them ideal for breakout targets.
Why Forex Traders Use These Tools
The Forex market is decentralized, meaning there is no single "official" volume. However, modern platforms use "Tick Volume" or institutional data feeds to create highly accurate profiles for pairs like EUR/USD or GBP/JPY.
1. Identifying Institutional Support/Resistance
Unlike a random line on a chart, a High Volume Node represents a level where thousands of contracts were exchanged. If the US Dollar returns to an HVN, it is highly likely to find "memory" there, leading to a bounce or a stall.
2. Spotting the "Smart Money."
Institutions cannot hide their footprints in the Volume Profile. When you see a massive spike in volume at a specific price followed by a fast move away, you’ve identified where "Smart Money" has entered the market.
3. Trading the "Value Area."
A common strategy taught at Global Markets Eruditio is the 80% Rule: If price opens outside the Value Area but then moves back into it and stays for two consecutive 30-minute periods, there is an 80% chance it will travel all the way to the other side of the Value Area.
Strategic Comparison: Which One Should You Use?
 https://images.squarespace-cdn.com/content/619b666b5842697e2af69258/a9d57b27-4fad-4532-874a-89133d6a85bc/P477.02.jpg?content-type=image%2Fjpeg
For most Forex traders, Volume Profile is the more versatile tool because the 24-hour nature of the currency market makes "time-based" sessions harder to define. However, combining both allows you to see if the market is staying at a price because it values it (Market Profile) or because it is absorbing a large order (Volume Profile).
The GME Academy Edge: Integrating Profiles into Your Routine
At Global Markets Eruditio, we don't just teach you to read indicators; we teach you to read the "Auction Process." Markets move from balance (consolidation) to imbalance (trend) and back to balance.
By using Volume and Market Profiles, you stop guessing where support is and start seeing where the market has actually transacted. This is the difference between being a "retail trader" and a "market professional."
Ready to stop trading blind and start seeing where the big money is moving?
Join our FREE Forex workshop today and learn the professional secrets of Volume and Market Profile with GME Academy!