

Cracking the Code: How Footprint Charts and Order Flow Reveal the "Smart Money"
In the standard world of Forex Trading, most participants are essentially looking at a map of where the market was. Candlesticks tell you the high, low, open, and close, but they leave out the most critical piece of the puzzle: the actual struggle between buyers and sellers happening inside each bar.
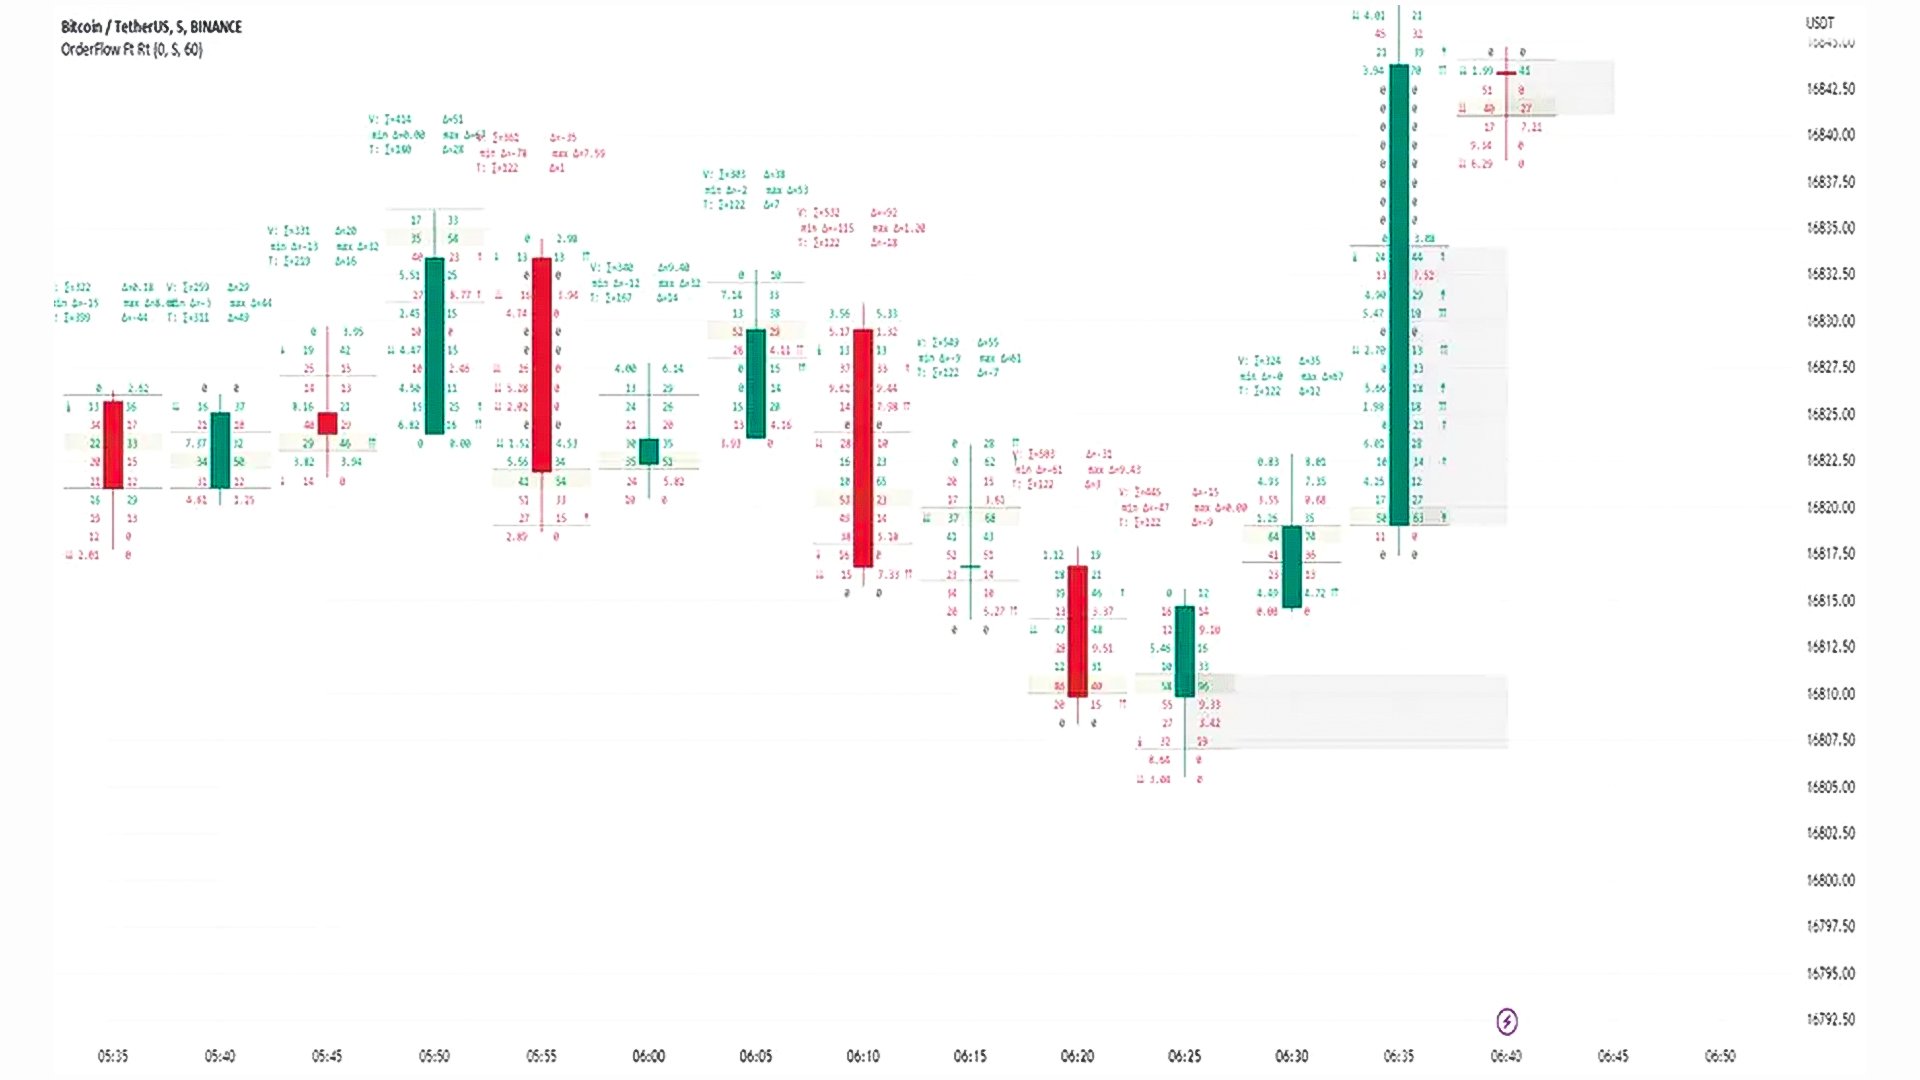
To truly understand why the US Dollar suddenly reverses or why the EUR/USD breaks through a major resistance level, you need to look at Order Flow and its most powerful visual tool: the Footprint Chart. At Global Markets Eruditio, we teach our students that mastering these tools is like having "X-ray vision" for the markets.
 https://images.squarespace-cdn.com/content/619b666b5842697e2af69258/a9d57b27-4fad-4532-874a-89133d6a85bc/P477.02.jpg?content-type=image%2Fjpeg
What is Order Flow Trading?
Order flow is the study of executed trades in real-time. While traditional technical analysis focuses on price patterns, order flow focuses on the auction process. It answers the "why" behind price movement:
Are buyers becoming more aggressive (hitting the Ask)?
Are sellers "absorbing" the buying pressure with large limit orders?
Is the current move backed by real volume, or is it a "liquidity hunt" designed to trap retail traders?
For Forex Trading for Beginners, it’s helpful to think of price as a car and order flow as the engine. A car can look like it's moving fast, but if the engine is stalling (declining volume/delta), a reversal is likely imminent.
Decoding the Footprint Chart
A Footprint Chart (also known as a Cluster Chart) is a multi-dimensional candlestick. It displays two sets of numbers at every price level within the bar:
Left Side (Bid): Represents aggressive sellers hitting the bid.
Right Side (Ask): Represents aggressive buyers lifting the offer.
Key Signals to Watch:
Stacked Imbalances: When buyers overwhelmingly outnumber sellers (or vice versa) across several consecutive price levels. This often signals a strong institutional move.
Unfinished Auctions: When a candle has significant volume at the very high or low, suggesting the market has "unfinished business" and will likely return to that level soon.
Delta: The net difference between buying and selling volume. A positive delta means buyers are in control; a negative delta favors the bears.
Applying Order Flow to Major Currency Pairs
Because the Forex market is decentralized, traders often use "Tick Volume" or Futures data (like the 6E for Euro or 6B for British Pound) to get an accurate representation of order flow.
EUR/USD & GBP/USD: These high-liquidity pairs are perfect for spotting Absorption. If you see a massive amount of buying volume on the footprint chart, but the price refuses to move higher, it means a "passive seller" (likely an institution) is absorbing the orders. This is a classic reversal signal.
USD/JPY: Given Finance Minister Katayama's recent "free hand" warnings, order flow is essential for spotting the exact moment the Japanese government might step in. You would look for a sudden, massive surge in sell-side delta that dwarfs previous activity.
The GME Academy Edge: Context is King
At Global Markets Eruditio, we warn our traders that a footprint chart without context is just a screen full of numbers. The true power of order flow is realized when you combine it with:
Market Structure: Is the order flow confirming a breakout or a reversal at a key daily level?
The Economic Calendar: High-impact news, like the recent Australian CPI or US labor data, creates the volatility that order flow helps you navigate.
Risk Management: Order flow allows for tighter stop-losses because you can see exactly where the "Smart Money" has entered the market.
Why Professionals Move Beyond Candlesticks
Professional traders don't trade on "hope" or "feelings." They trade on data. By utilizing Footprint Charts, you move from reacting to price to anticipating it. You stop being the liquidity that institutions target and start following the path they carve in the market.
Whether you are just starting Forex Trading for Beginners or are looking to refine your edge in the US Dollar markets, understanding the mechanics of the auction is your most important step toward consistency.
The "Smart Money" leaves footprints. Are you ready to follow them?
Join our FREE Forex workshop today and learn the professional secrets of Order Flow and Footprint Charts with GME Academy!