

Candlestick Secrets: The Chart Patterns Every Forex Trader Must Master
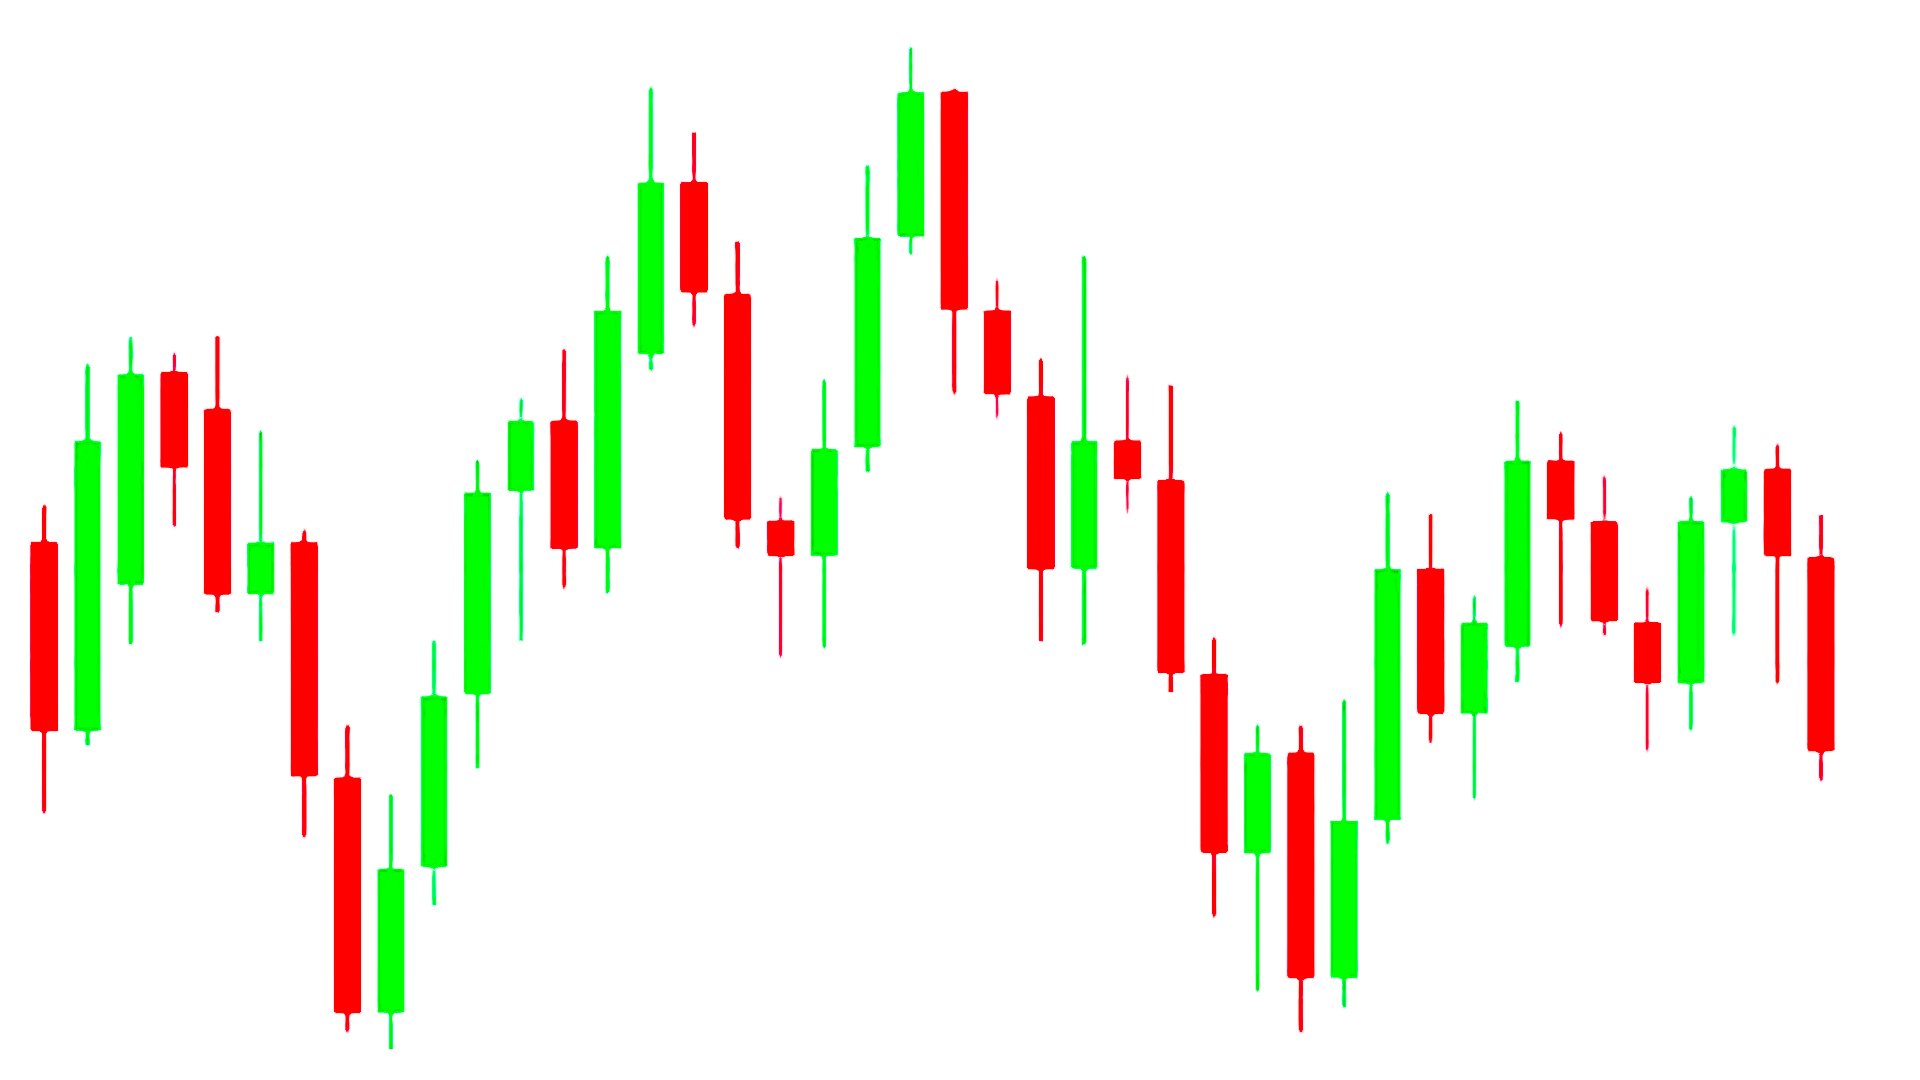
Candlestick patterns are the language of price. Before indicators, before trading systems, and before advanced tools, traders first learned to read the story unfolding on their charts. Today—especially in Forex trading—candlesticks remain one of the most powerful tools for identifying market sentiment, reversals, momentum shifts, and breakout opportunities.
Whether you're new to Forex trading for beginners or looking to refine your analysis skills, these patterns can dramatically improve how you interpret movement across major currency pairs like EUR/USD, GBP/JPY, USD/CAD, and others.
At GME Academy (Global Markets Eruditio), we emphasize candlestick mastery early in our curriculum because it forms the foundation of smart, informed, and strategic decision-making.
Below are the essential candlestick patterns every trader should know—complete with explanations, use cases, and how they apply in real-world Forex markets.
 https://images.squarespace-cdn.com/content/619b666b5842697e2af69258/a9d57b27-4fad-4532-874a-89133d6a85bc/P477.02.jpg?content-type=image%2Fjpeg
1. The Hammer & Hanging Man — The “Turning Point” Candles
The Hammer and Hanging Man are powerful single-candle signals that help traders identify potential trend reversals.
Hammer (bullish reversal): Appears at the bottom of a downtrend. Long lower wick tells you sellers pushed the pair down (e.g., USD/JPY), but strong buyers stepped in and regained control.
Hanging Man (bearish reversal): Appears at the top of an uptrend. The long lower shadow suggests early weakness, warning that buyers may be losing momentum.
These patterns help traders spot market exhaustion before major reversals take place—especially useful when trading volatile pairs like GBP/JPY or EUR/AUD.
2. Engulfing Patterns — The Market “Power Shift”
Suggested Image: Bullish and bearish engulfing candles overlaid on a chart showing trend change.
The Bullish Engulfing and Bearish Engulfing patterns show a complete shift in momentum.
Bullish Engulfing: A large bullish candle fully covers the previous bearish candle—a strong sign that buyers are taking control.
Bearish Engulfing: A strong bearish candle overtakes the previous bullish one, signaling that sellers are dominating.
In pairs like EUR/USD, these patterns often occur around key support and resistance zones, giving traders high-probability entry points.
3. The Doji — The Candle of Indecision
Suggested Image: A Doji candlestick centered on a chart with annotations explaining the equilibrium between buyers and sellers.
A Doji forms when the opening and closing prices are almost identical, showing that neither buyers nor sellers are in control.
A Doji often means:
The trend is losing strength
Volatility may be coming
A reversal or breakout could be near
In Forex trading, a Doji appearing before major data releases—like Canada’s GDP affecting USD/CAD—signals that traders are waiting for confirmation before committing to a direction.
4. Morning Star & Evening Star — The Strong Reversal Trio
These powerful three-candle reversal patterns are must-knows for any serious trader.
Morning Star (bullish reversal): Indicates the end of selling pressure and the start of a new bullish trend.
Evening Star (bearish reversal): Warns of fading bullish momentum.
Because they include confirming candles, these patterns are considered more reliable—especially on higher timeframes like the 4H or Daily chart when analyzing major pairs such as AUD/USD or USD/CHF.
5. The Inside Bar — The Calm Before the Breakout
An Inside Bar forms when the current candle is fully contained within the previous one—signaling consolidation.
This pattern commonly appears:
Before breakouts
During trending markets
Ahead of economic events
For example, before a major Fed announcement, you may see an Inside Bar on EUR/USD, telling you traders are waiting for clarity before making their move.
Inside bars are powerful tools for breakout traders who want tight setups and clear risk levels.
6. The Spinning Top — Warning: Trend Losing Strength
A Spinning Top indicates confusion, hesitation, and reduced conviction from both buyers and sellers.
When this pattern appears at the peak of a strong uptrend in pairs like GBP/USD, it may signal a potential pause—or even reversal—depending on the next few candles.
Why Candlestick Patterns Matter in Forex Trading
Candlesticks allow you to interpret:
Market momentum
Strength of buyers vs sellers
Potential reversals
Breakout setups
Market psychology
For Forex trading beginners, this is often the first technical skill that creates a noticeable improvement in decision-making and trade confidence.
Combined with support/resistance, trendlines, and economic context, candlestick patterns become a powerful toolset for analyzing currency pairs and building a solid trading strategy.
Let Price Tell Its Story
Candlestick patterns are not magic—they’re tools. But when interpreted correctly, they become one of the most accurate and intuitive ways to understand market movement.
The best traders don’t guess.
They read what the market is telling them.
If you want to master these patterns—and learn how professionals use them across pairs like EUR/USD, USD/CAD, GBP/JPY, and more—now is the perfect time to level up your skills.
Ready to take your Forex trading to the next level?
Join our FREE Forex Workshop at GME Academy and learn how to apply these candlestick strategies in real market conditions.
Start your trading journey with clarity, confidence, and expert guidance—sign up today!