

The Market's "Check Engine" Light: What is Divergence?
In the fast-paced environment of Forex trading, most market participants simply follow the price. However, elite traders—like those mentored at Global Markets Eruditio know that what the price says and what the market momentum does can sometimes tell two different stories. This phenomenon is known as Divergence.
Divergence occurs when the price of a currency pair moves in the opposite direction of a technical indicator (usually an oscillator like the RSI, MACD, or Stochastic). Think of it as a "Check Engine" light for a trend; it suggests that the current momentum is out of sync with the price action, signaling a potential shift in the market structure.
For those just starting with Forex trading for beginners, mastering divergence is one of the most effective ways to transition from reactive trading to predictive trading.
 https://images.squarespace-cdn.com/content/619b666b5842697e2af69258/a9d57b27-4fad-4532-874a-89133d6a85bc/P477.02.jpg?content-type=image%2Fjpeg
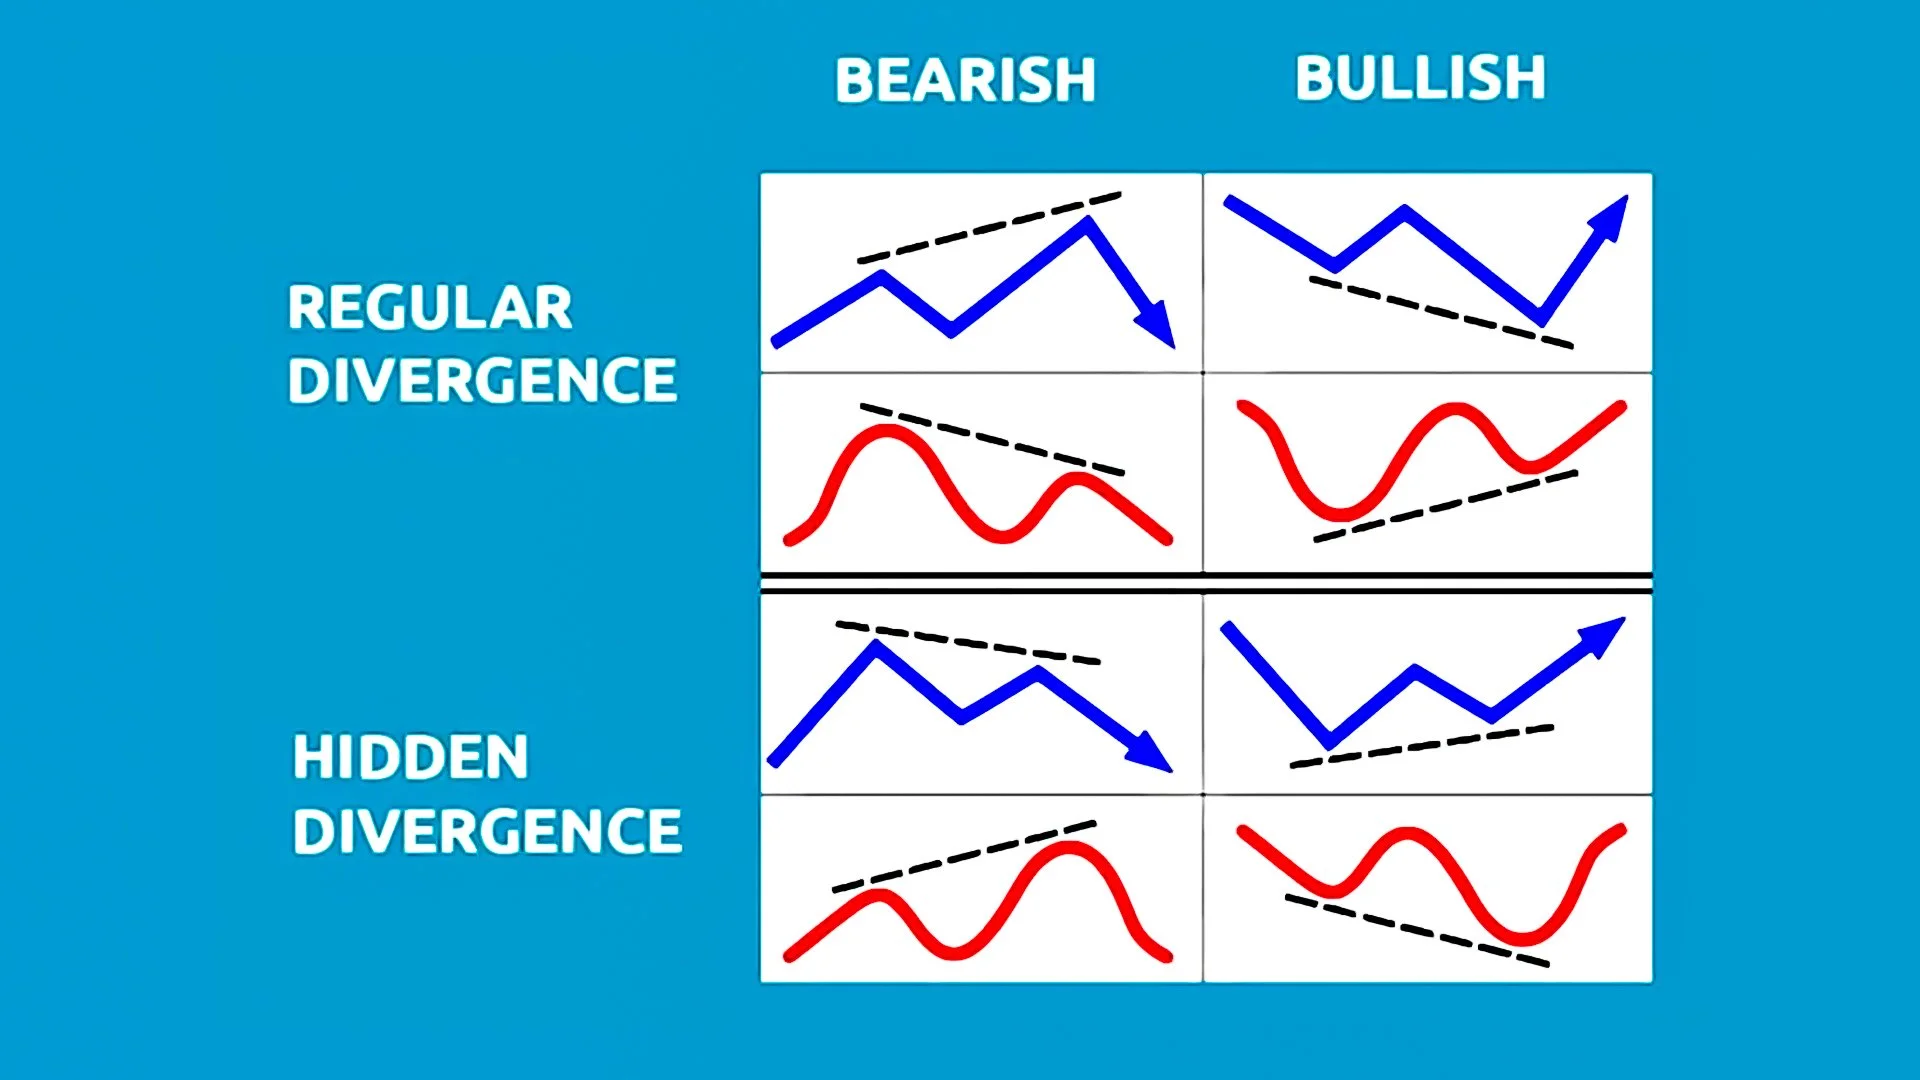
1. Regular Divergence: The Reversal Signal
Regular divergence is used primarily to spot the end of a trend. It tells you that even though the price is making a new extreme, the "fuel" behind the move is running out.
Regular Bullish Divergence
The Setup: Price makes a Lower Low, but the indicator makes a Higher Low.
The Interpretation: Sellers are losing steam despite the lower prices. This often precedes a bullish reversal.
Example: You might see this on the EUR/USD after a long downtrend, suggesting it’s time to stop selling and look for buy entries.
Regular Bearish Divergence
The Setup: Price makes a Higher High, but the indicator makes a Lower High.
The Interpretation: Buyers are exhausted. Even though the US Dollar (USD) might be reaching new peaks against its peers, the momentum is failing, signaling a potential crash.
2. Hidden Divergence: The Trend Follower's Secret
While regular divergence spots reversals, Hidden Divergence is the ultimate tool for trend continuation. It suggests that the underlying trend is much stronger than the current retracement looks.
Hidden Bullish Divergence
The Setup: Price makes a Higher Low, but the indicator makes a Lower Low.
The Interpretation: This occurs during a pullback in an uptrend. It signals that the market has "reloaded" its buying power and is ready to move higher.
Example: On a pair like the GBP/JPY, if the price dips slightly but the oscillator drops significantly, the "hidden" strength suggests the uptrend will resume.
Hidden Bearish Divergence
The Setup: Price makes a Lower High, but the indicator makes a Higher High.
The Interpretation: This happens during a retracement in a downtrend. It indicates that despite a temporary bounce, the sellers still control the Forex pair.

The Strategic Edge: Why It Matters
At GME Academy, we teach that divergence is most powerful when combined with Multi-Indicator Confluence. For example, seeing a Regular Bullish Divergence exactly at a major psychological support level on the Canadian Dollar (CAD) provides a much higher probability of success than seeing the divergence in "no man's land."
Understanding the nuance between "Hidden" and "Regular" prevents the common beginner mistake of trying to short a strong trend or buying into a dead reversal. It allows you to trade with the "big money" flows rather than against them.
Master the Art of Market Reading
Divergence is more than just a pattern; it is a window into the psychology of the global markets. Whether you are scalping the EUR/USD or position trading the US Dollar, these signals provide the clarity needed to stay ahead of the curve.
Ready to stop guessing and start reading the market like a pro? Global Markets Eruditio is dedicated to your success through evidence-based education.
Join our FREE Forex Workshop today to see live examples of Hidden and Regular Divergence and learn how to integrate them into your personal trading plan.